AVS Performance Metrics Breakdown: Uptime vs Rewards on Leaderboard

Imagine restaking your ETH on EigenLayer, only to watch rewards trickle in because your operator slacked on uptime. In the cutthroat world of AVS leaderboards, uptime isn’t just a metric- it’s your momentum indicator for stacking serious rewards. As a swing trader who’s timed countless entries using EigenLayer data, I’ve seen operators with rock-solid 99% and uptime turn modest restakes into compounded wins. Today, we’re slicing through AVS performance metrics, pitting uptime against rewards to spotlight leaderboard dominators ahead of re-pledge shifts.


High uptime means your stake stays active, opting into more AVS duties without slashing risks. Dune Analytics dashboards reveal operators hitting 99.87% over 90 days, like Figment, charging a lean 8% fee while backing heavy-hitters: EigenDA, Omni, and Brevis. Miss that threshold, and custom reward logic from AVSs kicks in, slashing your slice. Forum chatter from EigenLayer’s Operators Mainnet Campaign hammers it home: no less than 99% uptime, backed by 24/7 monitoring. Avail nodes clock 98%, Zora pushes 99.5%- close, but in uptime vs rewards AVS battles, fractions decide fortunes.
Decoding Leaderboard Leaders: Uptime’s Direct Reward Link
AVS leaderboards aren’t beauty contests; they’re data-driven battlegrounds for AVS leaderboard analysis. EigenCloud breakdowns show AVSs funneling performance-based rewards straight to operators via bespoke logic. Stake with a uptime champ, and you ride their wave- poor performers get sidelined. Take the top tier: operators blending multi-AVS support with vigilant monitoring dominate. This isn’t theory; it’s playbook for restakers eyeing 2026 EigenLayer metrics.
Top 5 AVS Operators: Uptime vs Rewards Leaderboard
| Operator | Uptime (90 days) | Fee % | Supported AVSs | Avg Reward APR |
|---|---|---|---|---|
| Figment | 99.87% | 8% | EigenDA/Omni/Brevis | 5.3% |
| P2P.org | 99.92% | 6.5% | EigenDA/Brevis/Avail | 5.5% |
| InfStones | 99.75% | 9% | Omni/EigenDA/Zora | 5.1% |
| Launchnodes | 99.60% | 7% | Brevis/Omni/Avail | 5.2% |
| Boreal | 99.45% | 8.2% | EigenDA/Zora | 4.9% |
That table underscores the grind. Zora’s edge at 99.5% might snag higher operator sets, but Figment’s diversified AVS lineup juices overall yields. Swing traders like me layer this with momentum signals- uptime spikes signal reward surges. LlamaRisk flags risks, sure, but activated AVS rewards propel self-sustaining ecosystems. Your move: scout these via Dune for real-time EigenLayer metrics 2026.
Real-World Rewards: A 60-Day Uptime-Powered Payday
Let’s get gritty with numbers from a delegator’s dashboard, starting August 1,2025, over 60 days. ETH staking alone delivered 0.512 stETH at 3.2% annualized APR. Layer on AVS restaking via a high-uptime operator? Bam- 0.336 stETH extra at 2.1% APR, totaling 0.848 stETH or 5.3% blended. Breakdown magic: EigenDA contributed 0.189 stETH (1.18% APR), Omni 0.094 stETH (0.59% APR), Brevis 0.053 stETH (0.33% APR). Uptime was the glue- Figment’s 99.87% kept duties flowing without interruptions.
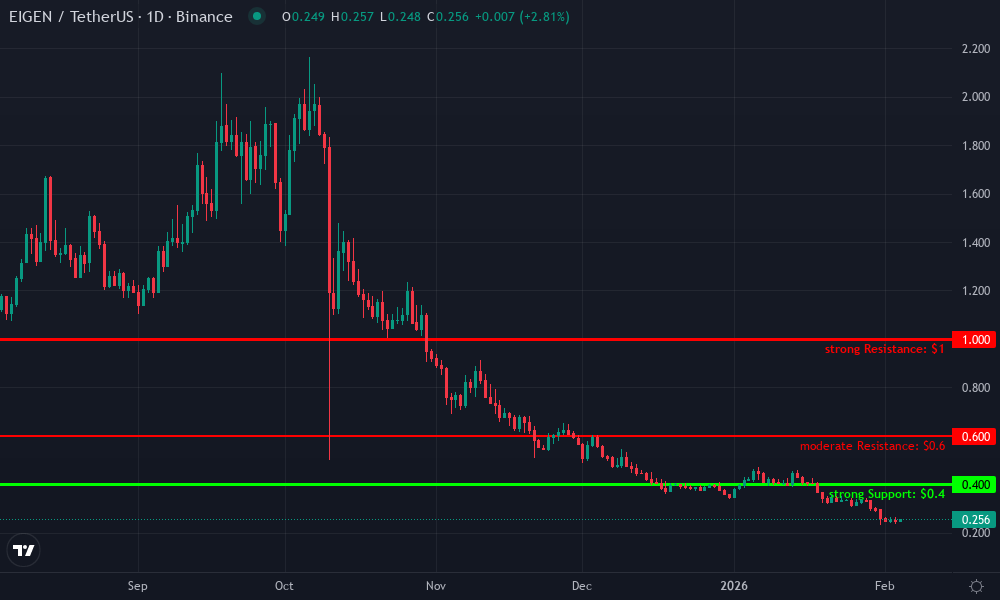
EigenLayer Technical Analysis Chart
Analysis by Market Analyst | Symbol: BINANCE:EIGENUSDT | Interval: 1D | Drawings: 6
Technical Analysis Summary
To annotate this EIGENUSDT chart effectively in my balanced technical style, start by drawing a primary downtrend line connecting the swing high in early November 2026 around 2.3 USDT to the recent swing low in late February 2027 at approximately 0.45 USDT, using the ‘trend_line’ tool with high opacity red color to highlight the dominant bearish channel. Add horizontal support at 0.40 USDT and resistance at 0.60 USDT and 1.00 USDT using ‘horizontal_line’. Mark the sharp breakdown volume spike in mid-December 2026 with a ‘vertical_line’ and downward arrow ‘arrow_mark_down’. Use ‘rectangle’ for the recent consolidation range from mid-January to February 2027 between 0.45-0.55 USDT. Place ‘callout’ texts for key insights like ‘Bearish MACD divergence’ and ‘Volume confirmation on drop’. Finally, add entry short zone at 0.50 with ‘short_position’ and stop loss above 0.60.
Risk Assessment: high
Analysis: Strong downtrend intact, low current price ~0.45 USDT vulnerable to further restaking FUD; no bullish reversal signals yet
Market Analyst’s Recommendation: Medium risk profile advises short bias or sit out; monitor for volume pickup above 0.6 for long consideration
Key Support & Resistance Levels
📈 Support Levels:
-
$0.4 – Recent swing low with volume cluster, potential oversold support
strong -
$0.35 – Psychological round number extension if breakdown
weak
📉 Resistance Levels:
-
$0.6 – Minor consolidation high, first hurdle for bulls
moderate -
$1 – Prior breakdown level from Dec drop
strong
Trading Zones (medium risk tolerance)
🎯 Entry Zones:
-
$0.5 – Short entry on rejection from minor resistance in downtrend continuation
medium risk
🚪 Exit Zones:
-
$0.35 – Profit target at extended support
💰 profit target -
$0.62 – Stop loss above resistance
🛡️ stop loss
Technical Indicators Analysis
📊 Volume Analysis:
Pattern: Spike on downside break in Dec 2026, confirming bearish move
High volume bars align with red candles during sharp drop, low volume on recent base suggests exhaustion
📈 MACD Analysis:
Signal: Bearish
MACD line below signal with widening histogram negative, divergence at highs
Applied TradingView Drawing Utilities
This chart analysis utilizes the following professional drawing tools:
Disclaimer: This technical analysis by Market Analyst is for educational purposes only and should not be considered as financial advice.
Trading involves risk, and you should always do your own research before making investment decisions.
Past performance does not guarantee future results. The analysis reflects the author’s personal methodology and risk tolerance (medium).
Visualize that chart: uptime plateaus correlate with reward ramps. Everstake guides claim these effortlessly, but savvy restakers track via dashboards for optimizations. In DePIN plays like EigenLayer’s AVS for WitnessChain, physical consensus demands unflinching uptime. Operators falter? Rewards redirect. My mantra: swing for the fences with smart stops- set alerts at 99% to pivot operators fast.
Operator Selection Secrets: Fees, AVSs, and Uptime Synergy
Don’t sleep on fees eating gains. Figment’s 8% is competitive, but pair it with broad AVS coverage for synergy. Pre-repledge top 5 AVSs per Moomoo rankings hoard restaking capital, promising fat revenues. Ava Protocol nails it: restake ETH or LSTs to secure these networks. Yet, AVS performance metrics crown those balancing uptime with diverse duties. Forum vets demand 7×24 alerts; leaderboard nodes deliver. As restaking heats up, prioritize operators where uptime fuels reward multipliers- your portfolio’s momentum depends on it.