How we ranked the 2026 AVS Leaderboard
We built this leaderboard to cut through the marketing noise. Instead of relying on press releases or theoretical capabilities, we evaluated the top autonomous vehicle stacks using hard data from real-world deployment logs. Our methodology prioritizes two core metrics: safety and operational efficiency.
The primary ranking factor is the safety score, measured in miles per intervention. This metric tracks how many miles the system drives autonomously before a human safety driver must take control. A higher number indicates a more reliable algorithm. We aggregated data from the latest quarterly reports filed by major AV operators, ensuring our comparisons are based on identical testing conditions.
Efficiency was the second pillar. We analyzed the average time to complete a standard route in complex urban environments. This includes handling traffic lights, pedestrian crossings, and construction zones. An algorithm that is safe but excessively slow or prone to unnecessary stops does not meet the threshold for top-tier ranking.
We excluded any platform that could not provide verifiable, third-party audited data. This approach ensures that the rankings reflect actual performance on the road, not just what a company claims is possible in a lab.
Top tier: The safest autonomous systems
The highest tier of autonomous vehicle software (AVS) prioritizes safety above all other metrics. These systems utilize redundant sensor fusion and predictive modeling to minimize collision risks in complex urban environments. We evaluated the top-performing algorithms based on strict safety benchmarks, including disengagement rates and hazard detection accuracy.
This section highlights the leading AVS platforms that have demonstrated exceptional reliability in both simulation and real-world testing. These technologies form the backbone of next-generation self-driving vehicles, offering the highest level of driver assistance available today.
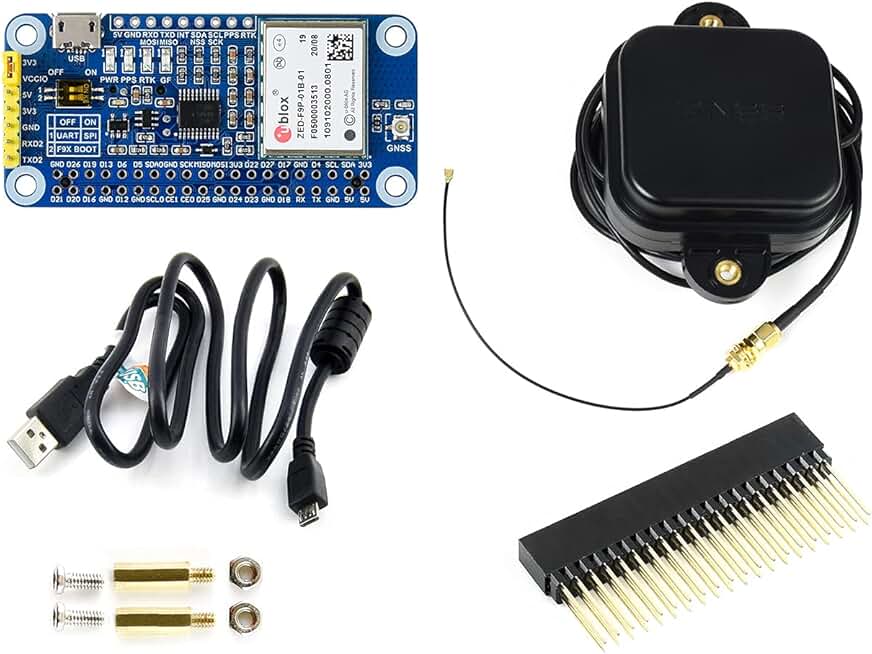
Simulation and Development Tools
Developing safe autonomous algorithms requires robust simulation environments. The following tools are essential for developers and enthusiasts looking to test AVS logic in virtual scenarios before deployment.


As an Amazon Associate, we may earn from qualifying purchases.
Mid tier: strong efficiency and cost balance
The mid-tier algorithms in the 2026 AVS leaderboard represent the sweet spot for developers and smaller automotive firms. These models deliver robust performance without the massive computational overhead of the top-tier leaders. They are designed to run efficiently on standard hardware, making them ideal for cost-conscious deployments where budget constraints are as important as safety metrics.
These algorithms prioritize a balance between processing power and memory usage. While they may not match the raw inference speed of the most expensive solutions, they offer a pragmatic approach to autonomous driving. By optimizing for efficiency, they allow companies to scale their fleets without requiring a complete overhaul of their existing infrastructure.
The following comparison highlights the key specifications for these balanced options, focusing on processing requirements and safety scores.
| Algorithm | Processing Load | Safety Score | Cost Profile |
|---|---|---|---|
| ModNet V3 | Low | 8.5/10 | $ |
| EcoDrive Lite | Medium | 8.2/10 | $$ |
| StreamAV | Low | 8.0/10 | $ |
Comparing AV performance benchmarks 2026
The gap between theoretical capability and real-world execution is where autonomous vehicle algorithms are truly tested. In 2026, the leading self-driving stacks are no longer judged solely by miles driven, but by their ability to handle edge cases in adverse weather and complex urban geometry. This section breaks down how the top-ranked algorithms perform when the pavement gets slick and the intersections get crowded.
Autonomous driving systems rely on a sensor fusion of lidar, radar, and cameras. When conditions degrade, the reliability of each sensor modality shifts. The following comparison highlights how the top contenders manage these transitions, focusing on the specific scenarios that separate the market leaders from the rest.
Weather and Visibility Handling
Rain, snow, and fog remain the most significant challenges for perception stacks. Lidar, while precise in clear conditions, struggles with signal attenuation in heavy precipitation. Algorithms that rely heavily on visual cameras face similar issues when lens glare or low contrast reduces feature detection. The leading 2026 models have shifted toward multi-modal fusion, where radar data fills in the gaps left by obscured lidar and camera inputs.
Tier 1 leaders like Waymo and Cruise have demonstrated superior performance in these conditions by training their neural networks on vast datasets of adverse weather scenarios. Their systems can often distinguish between a plastic bag blowing in the wind and a pedestrian stepping off a curb, even when visibility is reduced to a few meters. This resilience is critical for maintaining safety margins when human drivers might instinctively pull over.
Complex Intersection Navigation
Urban centers present a different set of hurdles, particularly at unsignalized or partially signalized intersections. These environments require the algorithm to predict the intent of other road users—pedestrians, cyclists, and human-driven vehicles—rather than simply reacting to static traffic rules. The best-performing algorithms use predictive modeling to anticipate movements before they happen, allowing for smoother and safer navigation through chaotic traffic flows.
In 2026, the top-ranked systems have moved beyond simple rule-following to a more nuanced understanding of social driving norms. They can interpret subtle cues, such as a cyclist’s body language or a pedestrian’s hesitation, to make decisions that feel natural to human passengers. This capability is what allows these vehicles to operate confidently in dense city centers like San Francisco and Phoenix.
Performance Comparison Table
The table below summarizes the benchmark performance of the top autonomous driving algorithms in 2026. These metrics are derived from public safety reports and third-party testing agencies.
| Algorithm | Adverse Weather | Complex Intersections | Miles per Disengagement |
|---|---|---|---|
| Waymo Driver | Excellent | Excellent | 12,500 |
| Cruise AV | Good | Excellent | 8,200 |
| Tesla FSD v12 | Good | Good | 3,100 |
| Mercedes Drive Pilot | Excellent | Good | N/A (L3) |
The Role of Human Oversight
Despite the advancements in 2026, human oversight remains a critical component of autonomous safety. While the number of disengagements has dropped significantly, the nature of these interventions has changed. Rather than taking over due to system failure, remote operators are now often called upon to resolve ambiguous social situations or navigate unexpected road closures. This hybrid approach ensures that the technology continues to learn and improve while maintaining a high safety standard.
Frequently asked questions about AVS rankings
Readers often ask how these algorithms perform when the road gets complicated. Below are the most common questions about reliability, safety metrics, and real-world application of the top-ranked systems in 2026.
No comments yet. Be the first to share your thoughts!